Step Through JavaScript Code
Start Debugger
* Start Firefox and browse to your page
* Open Firefox Developer Tool with one of following two methods:
– Press F12
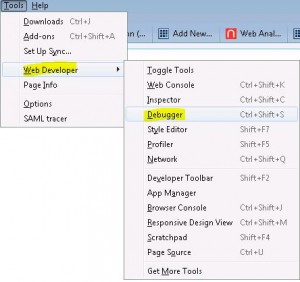
– Select Tools > Web Developer > Debugger
Set Break Point
* Reload your page by pressing F5
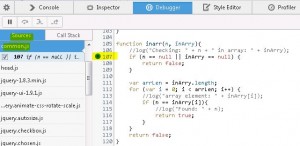
* Find and select you JavaScript source file, e.g. common.js
* Click the line number where you want to set break point
* Reload your page by pressing F5 again
* Web page will stop at your break point
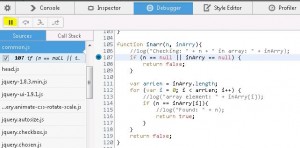
* Click the pause icon:
* Step through icons are enabled:
* You can now step over, step into, step out your Javascript code
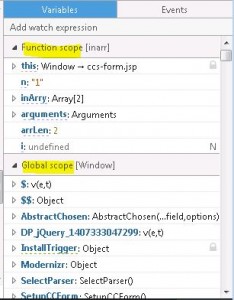
* Inspect variables:
– Local variable (Function scope) values
– Global variable (Global scope) values


